

Mortgage Debt Is High. Home Equity Is Higher.
Published on August 7, 2026 by
Stephanie Younger




One of the most persistent anxieties in the housing market right now is the fear of a repeat of 2008. Buyers wondering whether they are about to purchase at the top of a bubble. Sellers wondering whether they are about to miss their window. Homeowners watching the headlines about record mortgage debt and wondering whether the ground under their equity is about to give way.
The concern is understandable, but the underlying data tells a reassuring and often overlooked story. Yes, total mortgage debt is at an all-time high. But looking at debt in isolation is exactly the wrong way to read the market. When you look at the full picture, the numbers describe a market that is structurally resilient, not one poised for a crash.
Here is the data, what it actually means, and why it matters for anyone making a real estate decision on the Westside right now.
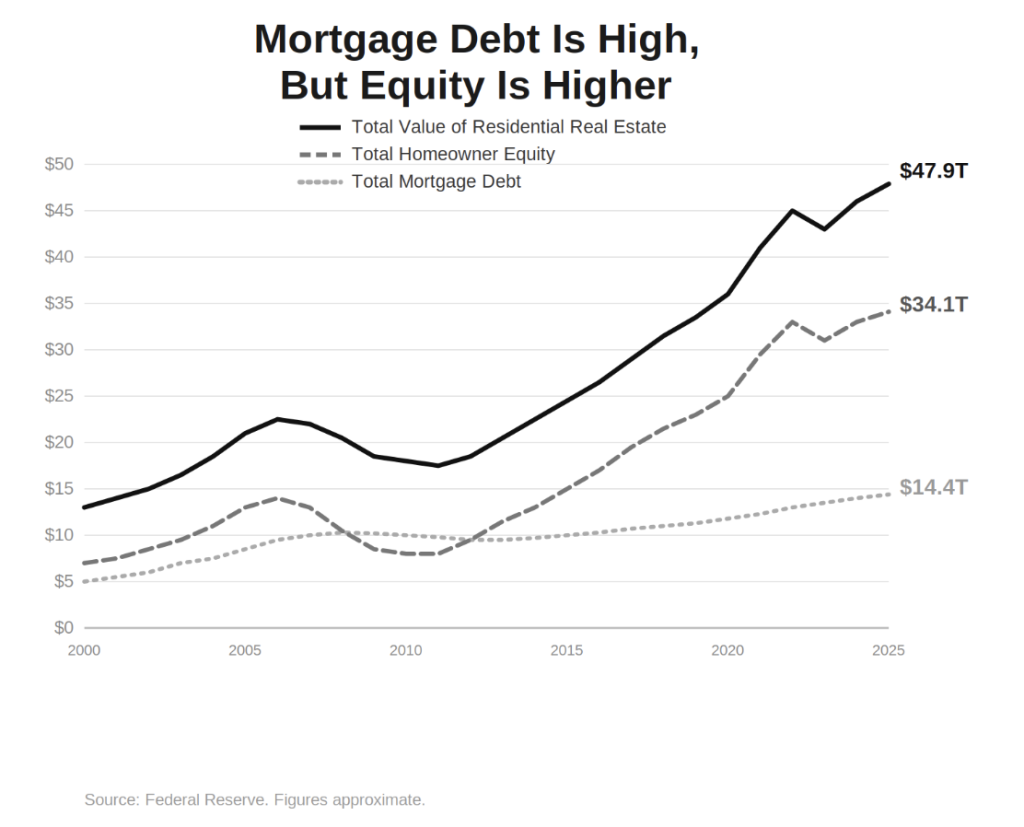
According to Federal Reserve data, the American housing market currently rests on three figures that need to be read together:
Total value of US residential real estate: roughly $48 trillion. This is the aggregate market value of all homes in the country, at or near an all-time high.
Total homeowner equity: roughly $34 trillion. This is the portion of that value that homeowners actually own outright, the difference between what their homes are worth and what they owe.
Total mortgage debt: roughly $14 trillion. This is the amount owed against all those homes. It is, in absolute terms, at an all-time high.
The headline that gets written from this data is almost always about the $14 trillion in debt. "Mortgage debt hits record high" is the story that generates clicks and anxiety. But that framing is genuinely misleading, because it looks at one number in isolation and ignores the two much larger numbers that give it context.
Debt in absolute terms will almost always be at an all-time high, for the same reason home values are: the market grows over time, prices rise, and the total dollar figures climb accordingly. A record debt number, by itself, tells you almost nothing about the health of the market. What matters is the relationship between the debt and the equity behind it.
And that relationship is overwhelmingly healthy. Homeowners hold roughly $34 trillion in equity against $14 trillion in debt. In other words, for every dollar of mortgage debt in the country, there are nearly two and a half dollars of equity behind it. Homeowners own the substantial majority of the value of their homes, with debt representing less than a third of total residential real estate value.
That is not the profile of a market on the edge of collapse. It is the profile of a market with a deep cushion of equity underneath it.
The reason this matters so much is that it is the structural inverse of the conditions that produced the 2008 crash.
The 2008 collapse was fundamentally a crisis of over-leverage and thin equity. Homeowners had borrowed heavily, often with little or no down payment, frequently with adjustable or exotic loan products they could not sustain. Equity cushions were thin to nonexistent. When home values declined even modestly, millions of homeowners found themselves underwater, owing more than their homes were worth. Underwater homeowners who could not make their payments had no equity to protect and no way out except foreclosure or a distressed sale. That wave of forced sales flooded the market with distressed inventory, which drove prices down further, which pushed more homeowners underwater, which produced more forced sales. It was a self-reinforcing downward spiral built on a foundation of thin equity.
The current market has the opposite foundation. Homeowners are sitting on historic levels of equity. The lending standards that have been in place since the post-2008 reforms have ensured that borrowers are qualified and that loans are sound. The exotic, no-documentation, no-down-payment products that fueled the last crisis are gone.
Here is the logic that follows directly from the equity picture, and it is worth stating plainly:
No equity, no cushion. Deep equity, deep cushion.
No cushion, forced sellers. Deep cushion, no forced sellers.
Forced sellers, crash. No forced sellers, no crash.
The mechanism that turns a market downturn into a market crash is forced selling, homeowners who have no choice but to sell into a falling market because they cannot make their payments and have no equity to fall back on. In a market where homeowners hold $34 trillion in equity, that mechanism is largely absent. A homeowner with substantial equity who hits a financial rough patch has options, refinancing, a home equity line, or simply selling into a healthy market and walking away with proceeds. They are not forced to dump the property at any price. And without a wave of forced sellers, the self-reinforcing crash dynamic of 2008 cannot get started.
The national equity picture is reassuring on its own, and it is even more pronounced in a market like the Westside of Los Angeles.
Westside homeowners, particularly those who have owned for any meaningful length of time, are sitting on some of the largest equity positions in the country. Decades of consistent appreciation, combined with the high absolute values of Westside property, mean that the typical long-term Westside homeowner holds a substantial equity cushion. That equity is precisely the buffer that prevents the forced-selling dynamic. Westside homeowners overwhelmingly have the financial flexibility to hold through any downturn rather than being forced to sell into one.
This connects directly to the structural resilience we have written about before. The Westside's combination of deep homeowner equity, constrained housing supply, and diversified high-income employment produces a market that is durable through cycles. The equity data is another piece of that same picture, and it is one of the most important pieces, because it addresses the specific fear, a 2008-style crash, that keeps buyers and sellers on the sidelines.
For sellers, this means the market underneath your home is fundamentally sound, and the equity you have built is real and defensible. For buyers, it means the fear of buying just before a crash is not supported by the structural data, the conditions that produced the last crash simply are not present. For everyone, it means the decision about whether to buy or sell should be based on your own circumstances and timing, not on anxiety about an imminent collapse that the data does not support.
When a client asks whether now is a bad time to buy or sell because a crash might be coming, this is the data to point to. Total mortgage debt is at a record high, yes, but that number in isolation is meaningless. The full picture, $48 trillion in value, $34 trillion in equity, $14 trillion in debt, describes a market with a deep equity cushion, sound lending, and no structural mechanism for the kind of forced-selling spiral that produced 2008.
Record debt is not the setup for a crash. Record equity is the setup for a resilient market. That distinction is one of the most important things any buyer, seller, or homeowner can understand about the current environment, and it is especially true on the Westside, where homeowner equity runs among the deepest in the country.
If you have been holding off on a decision because of crash anxiety, the data is worth understanding clearly. And if you want to talk through what it means for your specific situation, that is exactly the kind of conversation we are here for.
Data source: Federal Reserve, total value of residential real estate, total homeowner equity, and total mortgage debt. Figures are approximate and reflect the most recent available data.
Call 310.499.2020 or reach out online for a grounded read on what the current market means for your specific buying or selling decision.
Q: Is a housing crash coming in 2026?
The structural data does not support a 2008-style crash. The mechanism that turns a downturn into a crash is forced selling by homeowners who are underwater and cannot make their payments. In the current market, US homeowners hold roughly $34 trillion in equity against roughly $14 trillion in mortgage debt, meaning most homeowners have substantial equity cushions and financial flexibility. Without a wave of forced sellers, the self-reinforcing crash dynamic of 2008 cannot take hold. This is the structural opposite of the over-leveraged, thin-equity conditions that produced the last crash.
Q: Mortgage debt is at an all-time high. Isn't that a warning sign?
Not in isolation. Total mortgage debt is almost always at an all-time high, for the same reason home values are, the market grows over time and dollar figures climb. What matters is the relationship between debt and equity. Currently, homeowners hold roughly $34 trillion in equity against $14 trillion in debt, nearly two and a half dollars of equity for every dollar of debt. That ratio describes a market with a deep equity cushion, not one poised for collapse.
Q: How is the current market different from 2008?
The 2008 crash was a crisis of over-leverage and thin equity, homeowners had borrowed heavily with little down payment, often through exotic loan products they could not sustain. When values dipped, millions went underwater and were forced to sell, creating a downward spiral. Today's market has the opposite foundation: historic levels of homeowner equity, sound post-2008 lending standards, and none of the no-documentation, no-down-payment products that fueled the last crisis. The deep equity cushion prevents the forced-selling dynamic that drives a crash.
Q: What does home equity have to do with whether the market crashes?
Equity is the cushion that prevents forced selling. A homeowner with substantial equity who hits a financial rough patch has options, refinancing, a home equity line, or selling into a healthy market and walking away with proceeds. A homeowner with no equity who cannot make payments has only foreclosure or a distressed sale. Forced sales are what flood a market with distressed inventory and drive a crash. With $34 trillion in national equity, that forced-selling mechanism is largely absent.
Q: Why is the Westside of Los Angeles particularly well-positioned?
Westside homeowners, especially long-term owners, hold some of the largest equity positions in the country, the result of decades of consistent appreciation and high absolute property values. That deep equity is precisely the buffer that prevents forced selling, giving Westside homeowners the flexibility to hold through any downturn rather than sell into one. Combined with the Westside's constrained supply and diversified high-income employment base, the equity picture makes this one of the more structurally resilient markets in the country.


